What Is Power Down Cutoff Frequency?
Power-down cutoff frequency is an informal name for the pulse-frequency threshold below which a pulsed laser source cannot deliver its rated average power without exceeding its maximum permitted pulse energy. Manufacturer terminology varies. A source manual may call this threshold the base frequency, fundamental frequency, power-derating frequency, or maximum-energy frequency, or may show the relationship only in a pulse-frequency-versus-power chart.
Why the cutoff exists
In a simplified pulse train, average power equals the energy in each pulse multiplied by the pulse frequency. A source rated for 30 W average power would need 1 mJ per pulse at 30 kHz, but it would need 3 mJ per pulse at 10 kHz to maintain the same average power. If the source permits a maximum of 1 mJ per pulse, its available average power must decrease below 30 kHz rather than exceed the permitted pulse-energy limit.
Despite its name, the power-down cutoff frequency is not normally an on/off threshold. Below that threshold, the source normally continues emitting pulses, but its maximum available average output power decreases. In this idealized example, the maximum available average power below the threshold equals the maximum permitted pulse energy multiplied by the pulse frequency.
Why pulse duration changes it
The maximum permitted or achievable pulse energy may differ for each selectable pulse duration or pulse waveform. Short and long pulse settings can encounter different amplifier and peak-power limits, so each selectable pulse duration or waveform may have its own base frequency and permitted pulse-frequency range.
The power-down cutoff frequency is an attribute of the laser source for the selected pulse duration or waveform. When the selected pulse frequency falls below that cutoff, the source limits pulse energy and the available average output power decreases. Although reducing pulse frequency often increases pulse energy and peak power above the cutoff, reducing it further below the cutoff may no longer increase peak power and may instead only reduce the available average power. Use the manufacturer's table or curve for the exact pulse duration or waveform selected on the specific laser source model.
How to read a manufacturer chart
On a manufacturer chart, look for pulse frequency on the horizontal axis and maximum available average power or pulse energy on the vertical axis. A region where maximum available average power rises as pulse frequency increases usually indicates that the source is operating at its maximum permitted pulse energy. The point where the curve first reaches the source's rated average power, often called the knee, identifies the applicable base frequency or power-down cutoff frequency. Above the knee, the source may maintain its rated average power while the energy available to each pulse decreases as pulse frequency increases.
Some laser source manuals provide a table instead of a graph, listing the minimum pulse frequency, base frequency, maximum pulse frequency, maximum available power, and maximum pulse energy for each pulse duration or waveform. Do not use unlisted pulse-duration and pulse-frequency combinations outside the manufacturer's published operating regions unless the manufacturer explicitly confirms they are permitted.
What the software power percentage means below cutoff
Requesting 100 percent power below the cutoff does not necessarily produce the nameplate average wattage. It commonly requests the maximum output the source allows at that frequency and pulse duration. For example, if the source is limited to 1 mJ pulses at 10 kHz, its ceiling is approximately 10 W even if the nameplate rating is 30 W.
Controllers and sources can implement limiting differently. Some automatically derate, some reject invalid combinations, and some software interfaces obscure the effective output. The source manual and measured output behavior take precedence over a generic percentage field.
JPT E2 60 W M7 example
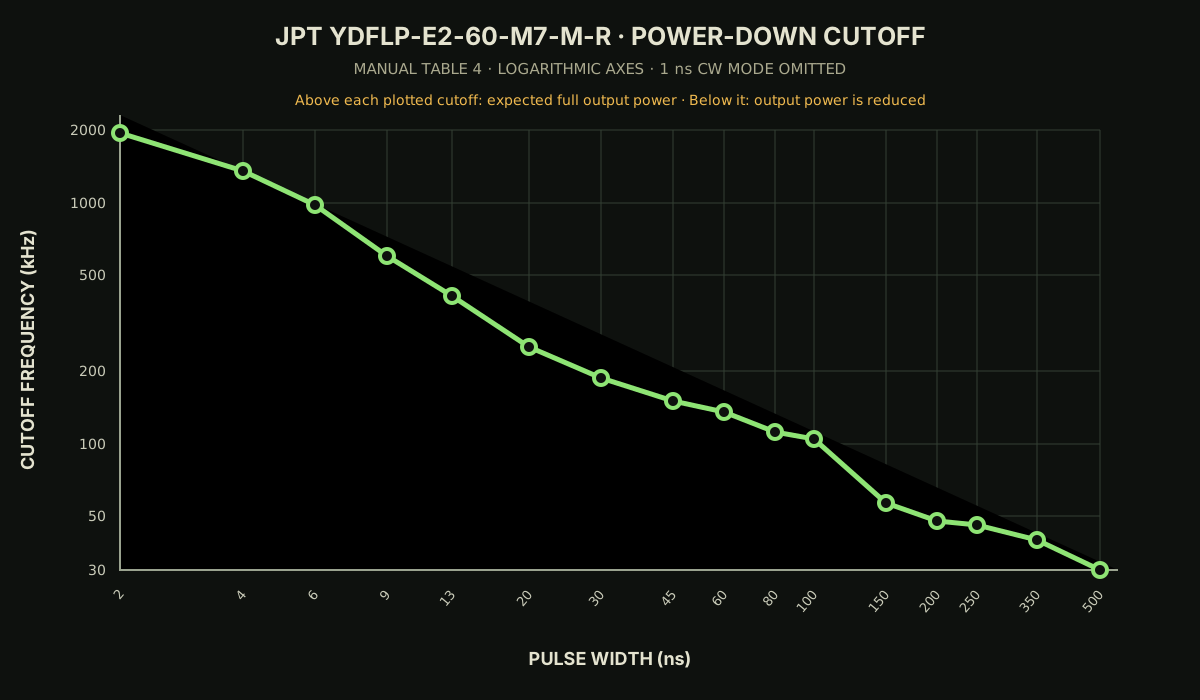
The chart on this page reproduces the cutoff-frequency values in Table 4 of the JPT YDFLP-E2-60-M7-M-R user manual. For its pulsed waveforms, the published cutoff falls from 1950 kHz at 2 ns to 30 kHz at 500 ns. The axes are logarithmic so both the short-pulse, high-frequency values and long-pulse, low-frequency values remain readable.
This curve applies only to the YDFLP-E2-60-M7-M-R table. JPT E2 M7 models at 20 W, 30 W, 100 W, 200 W, and other powers have different cutoff values and sometimes different maximum frequencies. The manual lists 1 ns separately as CW mode, so it is intentionally omitted from the pulsed cutoff curve.
Practical engraving consequences
Below the cutoff, lowering frequency may increase pulse energy until the source's cap is reached, but average power also falls. The mark can become more strongly driven by separated high-energy pulses even though less total energy arrives per second. Above the cutoff, average power may remain near rated output while pulse energy falls as frequency rises.
This can change ablation, texture, oxide growth, color, debris, and processing time. A copied recipe may therefore behave very differently on another source whose cutoff curve or pulse waveforms are different.
What to record and verify
Record the source manufacturer and exact model, selected pulse duration or waveform, commanded frequency, cutoff or base frequency for that waveform, maximum pulse energy, commanded power, speed, line interval, lens, focus, and material. Consult the manual's pulse-shape, pulse-energy, peak-power, and average-power charts before constructing a test matrix.
Stay inside every published minimum and maximum frequency, duty-cycle, pulse-width, and power constraint. A calculated value is only an explanatory estimate; it does not override the source's internal limits or manufacturer instructions.
Manufacturer links
These official sites are starting points for current specifications, regional availability, demonstrations, and support. Inclusion is not an endorsement or a guarantee of compatibility.
Raycus RFL-P30MX Pulsed Fiber Laser User Guide
Manufacturer guide with repetition-rate versus maximum-average-power and pulse-energy curves for different pulse durations.
Raycus P200S+ Pulsed Fiber Laser User Instruction
Manufacturer example tabulating minimum, base, and maximum frequency, power, and pulse energy by pulse-duration waveform.
IPG Photonics: Fiber Lasers 101
Manufacturer overview of pulse energy, repetition rate, peak power, pulse duration, and average power.
JPT YDFLP-E2-60-M7-M-R User Manual
JPT-branded source manual containing Table 4, the cutoff-frequency values reproduced in the chart.
JPT M7 20-100 W Product Family
Official JPT product-family page; use the exact model manual because cutoff values differ by rated power and variant.